The increase in the spatial and spectral resolution of Remote Sensing systems, while maintaining a wide viewing swath, leads to an increase in the volume of data that must be stored, processed, and transmitted through communication channels. At the same time, the comparatively low bandwidth of radio channels and the limited frequency range necessitate data compression. The primary goal of compression algorithms is to reduce data size while preserving its informational value. Various compression technologies are used to achieve compact data representation, traditionally categorized into lossless (reversible) and lossy (irreversible) compression. Lossy compression algorithms enable significantly higher compression ratios but alter the original data’s informational structure. On the one hand, some information is lost, making it critical that these losses are negligible for subsequent data processing and interpretation. On the other hand, distortions of various types are introduced, raising the issue of evaluating the parameters of these distortions.
As shown in [1, 2], the properties of compression-induced distortions (artifacts) depend on several factors, including the image properties, the codec used, and the compression-controlling parameter: the quality factor (QF) in the JPEG codec, bits per pixel (BPP) in the JPEG2000 codec, the quantization step (QS) in DCT-based codecs, and the Q parameter in the BPG codec [1]. Image properties primarily refer to the complexity of its structure and the presence of noise. Examples of images with simple structures include those with relatively few object classes representing statistically homogeneous (in color or intensity) regions. Images with complex structures include those with prominent textures and a large number of small objects. Various types of noise, perceived visually as multicolored dots or spots or as random pixels of different brightness or color, also contribute to the complexity of the image structure. It is noteworthy that, when evaluating the quality of compressed images, the uncompressed (original) image is often assumed to be ideal and noise-free, even though this is practically achievable only for synthetic images. All real-world images, regardless of their type or acquisition conditions, contain noise. Noise sources can vary, including imperfections in the image formation system, poor recording conditions, and transmission channel interference. Consequently, the noise present in an image often needs to be considered when selecting optimal compression parameters that provide the desired compression ratio at a given image quality level. For example, if an image contains predominantly high-frequency additive Gaussian noise, then lossy compression at the optimal operating point [3] (or at least in its vicinity) can have the additional positive effect of partially filtering the noise.
An analysis of the influence of additive noise on the statistical characteristics of distortions introduced by the Better Portable Graphics (BPG) codec was carried out in [2]. It was shown that, for noise-free images, the distribution of compression artifacts can be considered Gaussian with zero mean if the compression parameter Q does not exceed 25. As Q increases, the kurtosis rises, and the distribution of introduced distortions transitions to a so-called “heavy-tailed” distribution, while the mean and skewness estimates remain near zero. For images with additive noise, the distribution of combined distortions (due to both noise and compression) retains a normal (Gaussian) shape at a substantially higher Q value (up to 40), corresponding to visually noticeable image distortions.
Knowledge of the expected statistical characteristics of the distortions introduced by lossy compression is necessary for the development of effective post-processing procedures for compressed images, including preventing the reduction of classification accuracy.
The aim of this study was to conduct a statistical analysis of image distortions due to lossy compression using the AGU, JPEG, JPEG 2000 and WebP codecs.
JPEG is the most well-known and widely used representative of DCT-based codecs. Its advantages and disadvantages are well known. Among the main disadvantages are the inability to achieve high compression ratios due to the block size limitation of 8×8 pixels, the blocky structure of compressed images at high compression levels, and the rounding of sharp corners and blurring of small image details.
In contrast to JPEG, JPEG2000 uses wavelet transformation. This allows for higher compression ratios at the same image quality and eliminates the 8-pixel blockiness.
The AGU codec, like JPEG, is based on a two-dimensional DCT, but operates with image blocks of a fixed size of 32×32 pixels. In addition, AGU implements efficient bitwise coding of DCT coefficients after uniform quantization and deblocking of the decompressed image. These features allow the AGU codec to provide better quality of the decoded image compared to JPEG, JPEG2000 and other compression methods [1, 4].
The WebP codec is based on the still image compression algorithm (keyframes) from the VP8 video codec. Lossy WebP uses arithmetic coding (a type of entropy compression algorithm), block quantization with 16×16 block sizes for low entropy fragments (monotonic regions) and 4×4 blocks for high entropy fragments. It works based on predictive coding methods: pixel values in neighboring blocks are used to predict the values in the block, and only the difference is encoded. Like VP8, WebP supports only the 8-bit YUV 4:2:0 format (where YUV components are derived from the RGB color model: Y is luminance; U and V are chromatic components; U = B – Y, V = R – Y). With lossy compression, this can lead to color distortion in images with single-pixel contrast transitions. A key feature of WebP is that compression is achieved by reducing the quality of small details and textures while maintaining sharp edges and smooth transitions in homogeneous areas.
For statistical analysis of distortions caused by lossy compression, a 512×512 pixel image was used, formed using data from three spectral channels of the Sentinel-2 satellite in the optical range. This image of the area around the city of Kharkov was also used in [5]. The studied image has a relatively simple structure, and four generalized classes of objects of natural and anthropogenic origin can be distinguished on it: “constructions” (buildings, roads, dam), “reservoir”, “vegetation” and “bare soil”. Each class is represented by statistically homogeneous regions in terms of color (i.e., brightness values in the R, G, and B channels). For the study, the image was converted to grayscale, and four relatively homogeneous fragments with different average brightness levels were identified on the resulting image. For each fragment, local average brightness, local variance, and local relative variance estimates were calculated. It was assumed that noise in the original image was practically absent; thus, the variation in brightness values relative to the mean value was solely due to the stochastic properties of the spectral features of the corresponding object. The image was then compressed using the JPEG, JPEG 2000, AGU, and WebP codecs. The compression parameter was set to ensure the maximum compression ratio at which compression artifacts were visually perceived as insignificant. In this study, the compression ratios were as follows: JPEG – 39, JPEG 2000 – 22, WebP – 75, and for the AGU codec, the parameter Q was set to 51.
Analysis of local estimates of average intensity  and its variance  (k is fragment number) showed that lossy compression leads to shifts in statistical estimates, with this the highest relative errors δ observed for darker image fragments. For instance, for a fragment with 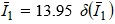 ranges from less than 1% (JPEG) to 7% (WebP), while  ranges from 43% (JPEG) to 67% (WebP). For brighter fragments, the relative errors of average intensity are significantly smaller. For a fragment with 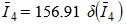 is less than 0.1% for WebP and about 1% for JPEG 2000. However, the error in variance estimation is significant and can reach 70% (JPEG 2000). Errors in local variance estimates are caused by the property of lossy codecs to partially smooth out variations in pixel values; that is, the codec acts on an image with high-frequency spatially uncorrelated noise as a low-pass filter, reducing the intensity variance. On the other hand, if the intensity distribution parameters need to be estimated with the highest possible accuracy (e.g., when training a statistical classifier), this compression-induced effect will lead to unacceptable estimation errors, ultimately reducing the reliability of object recognition in compressed images.
Subsequently, difference images Δ(i, j) were formed, which are often used in the analysis of images distorted due to lossy compression or various noise effects:
where  is the original (uncompressed) grayscale image,  is the compressed image (v denotes the type of codec).
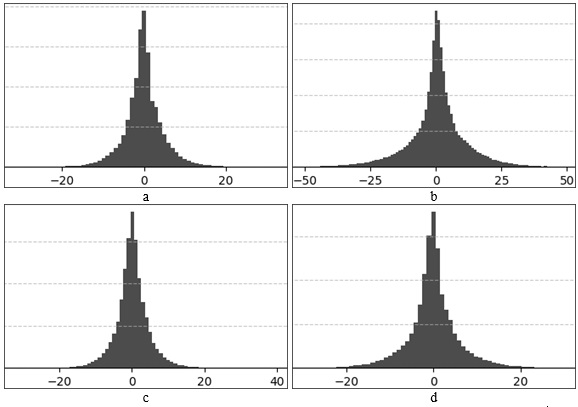
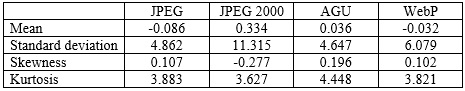
Histograms of distortions due to lossy compression are shown in Figure 1. Statistical characteristics for the distributions of these distortions are presented in Table 1. The results show that the distributions are symmetric, with almost zero values of mean, mode, and median. Since the kurtosis values for all cases under consideration are greater than zero, the distributions have heavy tails. For such distributions, the probabilities of extreme values cannot be ignored.
Figure 1. Distortion histograms for coders: (a) JPEG, (b) JPEG 2000, (c) AGU, (d) WebP
Table 1. Statistical characteristics of distortions.
Thus, distortions caused by lossy compression may manifest themselves in images as significant changes in the brightness (color) of individual pixels, which also reduces both the visual quality of the compressed image and the reliability of its classification.
At the next stages of the research, it is planned to develop methods that use the results of statistical analysis of the introduced distortions and allow us to evaluate the effectiveness of procedures for processing compressed images in order to increase the reliability of their classification.
References:
1. A Fast and Accurate Prediction of Distortions in DCT-Based Lossy Image Compression / V. Abramova et al. Electronics. 2023. Vol. 12, no. 11. P. 2347. URL: https://doi.org/10.3390/electronics12112347 (date of access: 15.01.2025).
2. Kovalenko B., Lukin V. Analysis of Distortions due to BPG-Based Lossy Compression of Noise-Free and Noisy Images. Вісник Хмельницького національного університету. 2023. No. 325(5). P. 128–135. URL: https://doi.org/10.31891/2307-5732-2023-325-5-128-135 (date of access: 13.01.2025).
3. Lukin V., Kovalenko B., Vozel B. A Fast and Accurate Prediction of BPG Compression Parameters in Optimal Operation Point Neighbourhood for Three-channel Noisy Images. . Fundamental Research and Application of Physical Science. 2023. Vol. 8. P. 129–160. URL: https://doi.org/10.9734/bpi/fraps/v8/7110A.
4. Still image/video frame lossy compression providing a desired visual quality / A. Zemliachenko et al. Multidimensional Systems and Signal Processing. 2015. Vol. 27, no. 3. P. 697–718. URL: https://doi.org/10.1007/s11045-015-0333-8 (date of access: 19.01.2025).
5. Image Classification Accuracy Analysis for Three-channel Remote Sensing Data / F. Li et al. Intelligent Information Technologies and Systems of Information Security, Proc. of the International Workshop, 23–25 March 2022. P. 1–15.
|